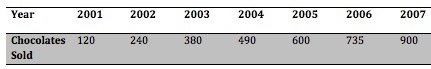
Given the following data, which of the following terms best describes the data?

Loading ...
Correct Answer: C. Linear
A linear trend is one in which an increase in x results in a linear increase in y. Thus, the slope essentially, is linear. Looking at the data from this chart, we can draw a rough plot and clearly see that it is linear. Exponential plots would result in a greater increase in y over time, and logarithmic plots would result in y approaching an asymptote over time.
Someone asked me if the real DAT will have questions as easy as this. Yes, it will, so you should be prepared for the simple stuff too to maximize your score. There is always that genius in differential equations that forgets the basics and somehow does poorly on QR. Don’t be that person.
Get it right? Get it wrong? Discuss this question with other
DAT Bootcamp students on Facebook:
Discuss on Facebook
Subscribe below to receive the DAT Question of the Day delivered straight to your inbox every morning.


